A modernized fork of the great pivottable.js with newer features and capabilities, better performance, better UI.
It is a pivot table library with drag'n'drop functionality.
- Conditional rendering of attribute filters dialog -> much better performance, no more 500 limit on attribute values
- Updated dependencies (such as):
- jQuery v1.11 -> v4
- gulp v2 -> v5
updated gulpfile - jasmine v2 -> v5
- D3.js v4 -> v7
- Refactor code for more modularity and aligning with FP standards
- Farsi(Persian) localization
- Slowly replace coffeescript with modern JS + JSdoc
- Write new code in modern FP javascript+jsDoc
- Spreadsheet exporting (Excel, XLSX)
- Async rendering: results rendering is now async. This leads to better performance an more freedom of writing renderers, but beware of how that works.
- Add billboard.js renderer (C3js is not maintained and incompatible with D3 > v6)
TODO
- Improve performance of rendering tables #1371
- Integrate a proper build tool (probably Vite.js) to modernize software and avoid the horrendous UMD export/imports, handle relative paths in build, enhance DX etc.
- add CI/CD
- fork pivottable.js wiki and enhance it for nu-pivottables
- Update README
- add integrations with other ecosystems (python, R)
- Remove dependency from JQuery and JQueryUI while keeping the project usable form JQuery (backward compatibility)
- Integrate Typescript into project and use where needed.
nu-pivottables' basic function is to enable data exploration and analysis by turning a data set into a summary table and then optionally adding a true 2-d drag'n'drop UI to allow a user to manipulate this summary table, turning it into a pivot table, very similar to the one found in older versions of Microsoft Excel with a bunch of extra developer-oriented features and some visualization effects. With optional add-ons, the summary table can be rendered as various kinds of charts, turning the pivot table into a pivot chart.
(The animation is from pivottables.js, nu-pivottables has updated UI) The animation above is based on the Canadian Parliament 2012 dataset example.
There are lots on the pivottable.js examples page note that nu-pivottables has some differences, we will add our own examples later.
Here are some good entry points:
- a JSFiddle where you can play with the code
- a simple demo running on the "Canadian Parliament 2012" dataset
- fully-loaded demo running on the 700+ datasets that ship with R
- fully-loaded demo where you provide your own CSV file for input
- it's lightweight: the core (without chart support) is a single file with ~1000 LOC of CoffeeScript, compiles down to 6.3kb of Javascript minified and gzipped, and depends only on jQuery and jQueryUI's 'sortable'
- it works wherever jQuery and jQueryUI work (tested with jQuery v3,v4 and jQueryUI 1.14)(also works with older versions from JQuery v1.9)
- it works acceptably fast in Chrome on commodity hardware up to around a hundred thousand records, depending on the cardinality of the attributes.
- its UI is localizable
- its layered architecture allows for summary table generation with or without the pivot table UI around it (if you don't use the UI, then there is no dependency on jQueryUI)
- it works with common input formats
- its derived attributes can be created on the fly based on the whole input record by passing in a function
- its complex aggregation functions can compute values based on the whole input record (e.g. weighted averages)
- it has built-in support for basic heatmap and bar chart renderers, and optional extra renderers that add charting or TSV export support
- its extension points allow aggregation functions, table output, UI and visualizations to be tailored to specific applications
- it has a test suite
Nu-Pivottables implements a pivot table drag'n'drop UI similar to that found in popular spreadsheet programs. You can drag attributes into/out of the row/column areas, and specify rendering, aggregation and filtering options. There is a step-by-step tutorial in the wiki.
Nu-Pivottables implements the Universal Module Definition (UMD).\
If you are loading the scripts directly (as in the examples), you need to:
- load the dependencies:
- jQuery in all cases
- jQueryUI for the interactive
pivotUI()function (see below) - D3.js, C3.js and/or Google Charts if you use charting plugins
- load the PivotTable.js files:
pivot.min.js- any plugins you wish to use
The dependencies and Nu-Pivottables files can be loaded By copying the files from their official distributions to your project and loading them locally (the dist directory is where you will find the PivotTable.js files)
(The examples load dependencies from CDNJS and PivotTable.js locally)
There are two main functions provided by Nu-Pivottables pivot() and pivotUI(), both implemented as jQuery plugins, as well as a bunch of helpers and templates.
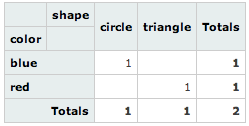
Once you've loaded jQuery and pivot.js, this code (demo):
$("#output").pivot(
    [
        {color: "blue", shape: "circle"},
        {color: "red", shape: "triangle"}
    ],
    {
        rows: ["color"],
        cols: ["shape"]
    }
);
appends this table to $("#output") (the default, overridable behaviour is to populate the table cells with counts):
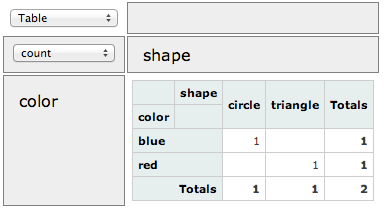
A slight change to the code (calling pivotUI() instead of pivot() ) yields the same table with a drag'n'drop UI around it, so long as you've imported jQueryUI (demo):
$("#output").pivotUI(
    [
        {color: "blue", shape: "circle"},
        {color: "red", shape: "triangle"}
    ],
    {
        rows: ["color"],
        cols: ["shape"]
    }
);
Note that pivot() and pivotUI() take different parameters in general, even though in the example above we passed the same parameters to both. See the FAQ.
See the wiki for full parameter documentation.
More extensive documentation can be found in the wiki:
- Frequently Asked Questions
- Full Parameter Documentation
- Input Formats
- Aggregators
- Renderers
- Derived Attributes
- Localization
- Optional Extra Renderers: Charting and Exporting
- Used By
To install the development dependencies, just run npm install, which will create a node_modules directory with the files required to run the Gulp build system.
After modifying any of the .coffee files at the top of the repo, you can compile/minify the files into the dist directory by running node_modules/gulp/bin/gulp.js
Once that's done, you can point your browser to tests/index.html to run the Jasmine test suite. You can view the current test results here.
The easiest way to modify the code and work with the examples is to leave a node_modules/gulp/bin/gulp.js watch serve command running, which will automatically compile the CoffeeScript files when they are modified and will also run a local web server you can connect to to run the tests and examples.
Pull requests are welcome! Here are some Contribution Guidelines.
Please first check the Frequently Asked Questions and if you can't find what you're looking for there, or in the wiki, then please create a GitHub Issue. When creating an issue, please try to provide a replicable test case so that others can more easily help you. Please do not email the author directly, as you will just be asked to create a Github Issue :)