
Replies: 21 comments 35 replies

Benchmarking Methodology Doc
1. ObjectiveThis evaluation will compare the performance and host-resource cost of The study will answer the following questions:
This is not intended to produce one universal score. Each result will be reported together with the runtime configuration and isolation path that produced it. 2. Metrics Matrix
3. Systems and Configuration VariantsThe following will be treated as distinct systems under test. Results from different backends will not be pooled.
For every identifier, the harness will store the runtime version, binary checksum, containerd configuration, runtime configuration checksum, hypervisor/monitor version, guest-kernel version, snapshotter, filesystem, and workload image digest. 4. Fairness Rules4.1 Same workFor each comparable experiment, every runtime will receive:
The custom C benchmarks will be compiled with a conservative common CPU target, not
Only common-core results will be used for direct all-runtime comparisons. Any source changes, linked-library differences, or unikernel-specific configuration will be disclosed. 4.2 Two resource-equivalence modesVM-backed and unikernel runtimes consume resources outside the payload process. A single definition of "equal memory" can therefore hide or unfairly charge this overhead. The experiments will use two separate modes.
The primary payload-equivalent profile will be 1 vCPU and 1 GiB payload memory. Scaling experiments will use Configured guest memory for Kata or 4.3 Host and software controls
4.4 Runtime defaults and tuningThe first comparison will use documented default production configurations. A tuned feature such as VM pooling, snapshot/restore, alternative gVisor platform, or different hypervisor will be evaluated as a separate named configuration. It will never be enabled for only one runtime while still labeling the result as a default comparison. 5. Harness DesignThe harness will be written primarily in Go. It will read a versioned experiment manifest, prepare a trial, invoke the selected runtime adapter, collect host and workload measurements, validate output, clean up, and write raw results. 
The runtime adapter will expose the following operations: All elapsed times will use Go's monotonic clock or 5.1 Proposed result layoutThe harness will preserve original tool output. Summaries will be generated from raw data and will never replace it. For payload-equivalent tests, the adapter will apply an invocation equivalent to the following. The exact command is generated from the manifest so trial directories and ports are unique and are not hard-coded in the benchmark scripts. nerdctl run --rm \
--runtime "$RUNTIME_HANDLER" \
--cpus "$PAYLOAD_CPUS" \
--memory "$PAYLOAD_MEMORY" \
--cpuset-cpus "$PAYLOAD_CPUSET" \
--name "$TRIAL_ID" \
"$IMAGE_DIGEST" \
"$BENCHMARK_COMMAND"The final lifecycle adapter will use the containerd API instead of spawning this command. Native baselines will run in a transient cgroup with the same CPU set, quota, and memory limit. 6. Lifecycle Methodology6.1 WorkloadThe lifecycle latency experiment will use The image will be pulled, unpacked, and pinned by digest before timed trials begin. The container will use the image's default command so that the benchmark does not add shell startup overhead through HTTP readiness will be measured by probing the nginx HTTP endpoint after the task-start request is issued. If the default For 6.2 Measurement boundariescontainerd distinguishes a container metadata object from a live task. Creating metadata with The primary lifecycle measurements will be event-based. The harness will issue lifecycle operations through the containerd Go client, but the recorded OCI lifecycle boundaries will be based on the corresponding containerd task events.
Only these four metrics will be reported as the primary lifecycle results. The containerd Go client will be used so that CLI process startup is not included. However for gVisor, we shall use the CLI by invoking the During harness development, event-based measurements may be validated against equivalent A runtime adapter layer will be used where necessary. For example, runc and Kata commonly use Runtime v2 handlers such as 6.3 Lifecycle experiment procedure
The HTTP-readiness test includes application initialization and network availability, so it will be reported separately from OCI task start. It will involve a separate process, attempting to connect to the container port in very short intervals, and then record the timestamp once a valid connection is made If a runtime cannot reliably produce the required task events through the selected containerd handler, its lifecycle results will not be silently mixed into the main comparison. The failure mode will be reported separately, and the runtime may be measured through a runtime-specific adapter only if that adapter's boundaries are clearly documented. 7. CPU Methodology7.1
|
| Mode | Exact work | What it measures |
|---|---|---|
prime |
Count primes in a fixed integer range using the same deterministic algorithm | Integer compute throughput |
sha256-scalar |
Repeatedly hash a deterministic in-memory buffer using a scalar implementation | Compute and memory-processing throughput without optional crypto instructions |
getpid-raw |
Repeated syscall(SYS_getpid) calls |
Raw syscall transition overhead |
clock-raw |
Repeated syscall(SYS_clock_gettime, ...) calls |
Raw time-related syscall overhead |
clock-vdso |
Repeated libc clock_gettime() calls |
Fast-path/vDSO behavior, reported separately from raw syscall mode |
futex-pingpong |
Two threads alternate through a futex word | Synchronization and scheduler overhead |
pipe-pingpong |
Two threads exchange one-byte tokens through two pipes | IPC, syscall, and context-switch overhead |
The binary will accept --mode, --duration, --iterations, --threads, --warmup, and --seed. Before measurement it will initialize deterministic inputs and synchronize all workers on a barrier. It will then measure only the selected operation and emit JSON containing:
- Workload and parameters
- Elapsed monotonic time
- Total and per-thread operation counts
- Operations per second or MiB/s
- Per-operation latency where applicable
- Correctness checksum
- Whether all threads completed
7.2 CPU execution plan
- Run the identical binary natively in a transient host cgroup and through every compatible runtime.
- Use a five-second in-process warm-up followed by a 30-second measured interval.
- Run 10 measured repetitions per mode, runtime, and thread count.
- Test thread counts
1,2, and4, without exceeding the allocated CPUs. - Pin the payload and identify/pin supporting processes consistently where the runtime permits it.
- Capture workload cgroup
cpu.statfields (usage_usec,user_usec,system_usec,nr_throttled, andthrottled_usec), total supporting-process CPU, host CPU delta, context switches, migrations, page faults, CPU PSI, andperf statcounters.
perf stat will collect cycles, instructions, branches, branch misses, context switches, migrations, and faults where the runtime and hardware allow them. Unsupported or multiplexed counters will be marked rather than replaced with zero.
7.3 CPU results
The primary result will be useful throughput. Cost will be expressed as total host CPU seconds per million operations. I will report:
For lifecycle-style comparisons without a native equivalent, runc will replace native in the denominator.
8. Memory Methodology
8.1 memory-bench workload
I will build a statically linked C program named memory-bench. It will emit timestamped JSON events named READY, ALLOCATED, TOUCHED, HOLDING, VERIFIED, and RELEASED. The host collector will align its samples with these phases.
Memory will be written with non-zero deterministic data one page at a time. This prevents a large virtual allocation from being mistaken for physically backed memory. A checksum will be verified before release.
| Mode | Procedure | Primary result |
|---|---|---|
idle |
Initialize, emit READY, allocate no large buffer, hold for 60 s |
Fixed sandbox memory cost |
alloc-touch |
Allocate and touch 64, 256, and 512 MiB, then hold each size for 30 s |
Host growth for known touched bytes |
incremental |
Add and touch 64 MiB every 5 s until the selected maximum | Incremental memory slope and reclaim behavior |
bandwidth-read |
Repeated sequential reads from a pre-touched buffer for 30 s | GiB/s and host CPU/GiB |
bandwidth-write |
Repeated sequential writes to a pre-touched buffer for 30 s | GiB/s and host CPU/GiB |
bandwidth-copy |
Repeated copy between two pre-touched buffers for 30 s | GiB/s and host CPU/GiB |
pagefault-seq |
Map a fixed region and touch one byte per page sequentially | Faults/s and ns/page |
pagefault-random |
Touch pages in a deterministic random permutation | Faults/s and ns/page |
pointer-chase |
Follow a deterministic randomized pointer chain in a fixed working set | Memory-access latency |
limit |
Increase touched memory toward and beyond a cgroup limit | Reclaim, pressure, OOM, and exit behavior |
8.2 Host-side memory collector
The Go collector will discover and track:
- Payload cgroup
- Sandbox/parent cgroup
- containerd shim
- gVisor Sentry and Gofer processes
- Kata VMM and shim processes
uruncmonitor/VMM and supporting processes
It will sample inexpensive cgroup and /proc counters every 100 ms. PSS from /proc/<pid>/smaps_rollup will be sampled every one second because it is more expensive. It will collect:
| Accounting layer | Values |
|---|---|
| Guest configuration | Configured guest RAM, vCPUs, ballooning and sharing settings |
| Guest-visible state | Guest total/free/available memory where collection is supported without changing the workload |
| Payload cgroup | memory.current, memory.peak, anonymous/file/slab breakdown, swap, events, PSI |
| Sandbox cgroup | Total cgroup consumption including support processes where hierarchy permits |
| Host processes | RSS and PSS for shim, Sentry/Gofer, VMM, monitor, and related processes |
| Host | MemAvailable, /proc/vmstat, host memory PSI, OOM events |
RSS values will not be summed as the main memory result because shared pages can be counted repeatedly. PSS, cgroup totals, and host deltas will be reported as separate views. I will not add them together if their accounting boundaries overlap.
8.3 Memory experiment procedure
- Capture host and runtime baseline before create.
- Start the workload and wait for
READY. - Sample the idle phase for 60 seconds.
- Trigger exactly one selected memory mode.
- At
TOUCHED/HOLDING, confirm the expected checksum and touched-byte count. - Continue collecting through
RELEASEDand deletion. - Measure time for host memory to return within 5% of the pre-trial baseline.
- Mark OOM kills and allocation failures as outcomes, not outliers.
Each regular memory mode will have 10 measured repetitions. Limit/OOM tests will have at least five repetitions and will run inside a host-safe top-level cgroup with a timeout.
8.4 Density measurement
The idle mode will be launched at instance counts 1, 2, 4, 8, and successive powers of two until a predeclared stopping condition. An instance counts as healthy only if it emits READY, remains alive for 60 seconds, and responds to a validation request.
The run will stop when any of the following occurs:
- More than 1% of instances fail
- Any host OOM kill occurs
- Host memory PSI
fullexceeds the predeclared safety threshold - Readiness p99 exceeds the timeout
- The host reserve falls below the predeclared safe minimum
The incremental bytes per additional sandbox will be estimated from the slope of total host memory versus healthy instance count, not only from a one-instance RSS snapshot.
9. Storage Methodology
9.1 Storage paths
Two storage paths will be tested and reported separately:
- Data volume: the same host-backed benchmark directory or block volume mounted into each runtime
- Root filesystem: the runtime's normal writable root filesystem
The data-volume path is the primary comparison because it uses the same underlying host storage. Root-filesystem results are secondary because snapshotter and image-layout effects are part of that path.
9.2 fio workload matrix
The pilot default will use a 4 GiB test file, 10-second ramp-up, 60-second measured duration, one job, and JSON+ output. If the test host cannot support 4 GiB safely, the size will be reduced once during the pilot and then frozen for every runtime.
| Test | rw |
Block size | I/O depth | Purpose |
|---|---|---|---|---|
| Sequential read | read |
1 MiB | 1 and 32 | Streaming read throughput |
| Sequential write | write |
1 MiB | 1 and 32 | Streaming write throughput |
| Random read | randread |
4 KiB | 1 and 32 | Read IOPS and latency |
| Random write | randwrite |
4 KiB | 1 and 32 | Write IOPS and latency |
| Mixed random | randrw, 70% read |
4 KiB | 32 | Database-like mixed I/O |
| Sync write | write with sync/fsync policy |
4 KiB | 1 | Durability-path latency |
Representative command template:
fio \
  --name="$TEST_ID" \
  --filename=/bench/testfile \
  --rw="$RW_MODE" \
  --bs="$BLOCK_SIZE" \
  --iodepth="$IO_DEPTH" \
  --ioengine="$IO_ENGINE" \
  --size=4G \
  --direct=1 \
  --time_based=1 \
  --ramp_time=10 \
  --runtime=60 \
  --group_reporting=1 \
  --output-format=json+
The mixed randrw profile will additionally set --rwmixread=70. Each trial will receive a private benchmark-data directory created by the harness and mounted at /bench; tool output will be written to that trial's raw-result directory by the harness.
The chosen I/O engine will be one supported equivalently by the common-core runtimes. Direct I/O support will be verified for every path. If a runtime does not honor or support direct I/O, that result will be marked incompatible; it will not silently fall back to buffered I/O. Buffered and direct tests will be separate experiment profiles.
Read tests will use a prepared file. Preparation, cache handling, and cleanup will occur outside the timed interval. Cache-cold and cache-warm tests will never be averaged together.
9.3 Metadata and secondary file I/O
sysbench fileio will be used only as a secondary filesystem-level check. It is not a pure metadata benchmark. For metadata overhead, the common static benchmark will execute fixed batches of create, stat, rename, and unlink operations on empty files in private per-trial directories. It will report operations/s, p50/p95/p99 operation latency, errors, and a final directory-count validation.
The secondary sysbench profile will use the same prepared data size and one thread:
sysbench fileio \
  --file-total-size=4G \
  --file-test-mode=rndrw \
  --file-io-mode=sync \
  --threads=1 \
  --time=60 \
  --rand-seed="$SEED" \
  run
Its prepare, run, and cleanup stages will use a private per-trial directory; only run will be timed.
9.4 Storage metrics
For each fio job I will retain:
- Read/write MiB/s
- Read/write IOPS
- Submission, completion, and total latency
- p50, p95, p99, and p99.9 completion latency
- Workload and total host CPU time
- CPU seconds per GiB or per million I/O operations
- cgroup
io.stat, physical-device/proc/diskstats, and I/O PSI deltas - Short I/O and error counts
Every storage profile will use 10 measured repetitions. Results will identify the device, filesystem, snapshotter, mount options, free space, cache state, and I/O engine.
10. Network Methodology
10.1 Server and topology
I will use a standard nginx webserver. In the case of urunc, I will repackage it into a runnable image that urunc can run.
Fortio will run either on a dedicated peer or in a fixed host-network container pinned to reserved host CPUs.
The primary path will be host/peer -> runtime network interface -> benchmark server. Loopback and cross-instance paths, if added, will be separate topologies.
The server will be launched through the runtime adapter with the common payload limits. An equivalent exploratory command is:
nerdctl run --rm --detach \
  --runtime "$RUNTIME_HANDLER" \
  --cpus 1 \
  --memory 1G \
  --cpuset-cpus "$PAYLOAD_CPUSET" \
  --publish "$HOST_PORT:8080" \
  --name "$TRIAL_ID" \
  "$HTTP_BENCH_IMAGE_DIGEST" \
  /http-bench-server --listen=:8080 --workers=1 --payload-bytes=1024
The published-port/CNI path is part of this end-to-end network test and will be held constant. A host-network result, if collected, will be labeled as a different topology.
10.2 Fortio test profiles
| Profile | Fortio configuration | Result |
|---|---|---|
| Baseline HTTP RTT | -qps 10 -c 1, at least 1,000 requests |
Low-load request round-trip distribution |
| Fixed-load curve | Shared QPS grid, -c 50, 60 s |
Achieved QPS, errors, p50/p90/p99/p99.9 |
| Connection scaling | Fixed QPS at -c 1,10,50,100 |
Effect of concurrency |
| Maximum HTTP throughput | -qps 0 at fixed connections |
Maximum successful requests/s and MiB/s |
| Raw TCP throughput | iperf3, one and four streams, both directions, 60 s |
Gbit/s, retransmits, and host CPU cost |
| Tail under constraints | Fixed QPS while applying the constraint schedule in Section 11 | Tail amplification, errors, and recovery |
The initial shared QPS grid will be 100, 500, 1000, 2000, and 4000 QPS. A pilot will check whether this spans low load through saturation. The grid may be adjusted once and then frozen. Every runtime will receive the same offered loads; runtime-specific QPS values will not be selected after seeing final results.
Representative Fortio command:
fortio load \
  -qps "$QPS" \
  -c "$CONNECTIONS" \
  -t 60s \
  -json "$RESULT_FILE" \
  "http://$TARGET/fixed"
For p99.9 reporting, each measured trial must contain at least 100,000 completed requests. Otherwise p99.9 will be marked exploratory because too few observations exist in the upper 0.1%. Each profile will have 10 repetitions.
Fortio is selected because it can generate a specified QPS and stores latency histograms and percentiles in JSON. wrk is not selected because its closed-loop behavior can hide delayed request opportunities. wrk2 is not rejected for this reason: it was specifically designed to compensate for coordinated omission. Fortio is preferred here for one consistent Go/JSON harness and fixed-QPS workflow.
iperf3 will be used for the separate raw TCP bulk-throughput question, using JSON output, one and four parallel streams, and both send and reverse directions. A representative client command is:
iperf3 \
  --client "$TARGET_IP" \
  --time 60 \
  --parallel "$STREAMS" \
  --json
The server will run inside the system under test using the same resource profile. The exact iperf3 version and binary will be identical where packaging permits; otherwise this test will remain in the extended matrix. iperf3 does not provide HTTP request tail latency, so these results will be labeled network-layer throughput and will not replace Fortio results.
10.3 Network metrics
- Offered and achieved QPS
- Successful and failed requests
- HTTP request RTT mean, p50, p90, p95, p99, and p99.9
- Maximum latency and timeouts
- Response MiB/s
- Raw TCP Gbit/s and retransmits from
iperf3 - TCP retransmits and socket errors
- Payload CPU and complete host CPU seconds
- CPU seconds per million successful requests
- Interface packet/byte counters
- Configuration path, including QEMU/KVM, Firecracker, TAP/virtio, and CNI details

11. Tail-Latency and Stress Methodology
Tail behavior will be evaluated as a cross-cutting experiment rather than a new synthetic workload. The same CPU, storage, or HTTP workload will first run without contention, then under one declared constraint.
11.1 Constraint profiles
| Profile | Constraint | Compared with |
|---|---|---|
| CPU-half | Payload limited to 0.5 vCPU | Same workload at 1 vCPU |
| Memory-half | Payload limited to 512 MiB | Same workload at 1 GiB |
| Host-budget | Entire sandbox placed under the shared host-budget profile | Payload-equivalent profile |
| I/O-constrained | Fixed cgroup I/O limit or controlled competing I/O | Unconstrained storage profile |
| Burst | Launch 1, 2, 4, and 8 instances simultaneously |
Serial launch |
11.2 Controlled spike test
For the HTTP workload, Fortio will apply a fixed offered load for 90 seconds. The sequence will be:
0-30 s: normal resource profile30-45 s: apply the declared CPU, memory, or I/O constraint45-90 s: restore the original profile and observe recovery
Only one constraint changes in a trial. The harness will record the exact monotonic timestamp of the change. Results will be divided into before, during, and recovery windows and will report p99/p99.9, achieved QPS, errors, and time to return within 10% of the pre-spike p99.
OOM tests will not be combined with service-latency tests. They will run separately with strict top-level host limits, timeouts, and cleanup checks.
12. Variance Handling
12.1 Repetitions and warm-up
| Experiment | Warm-up | Measured repetitions |
|---|---|---|
| Lifecycle warm | 3 untimed trials | 30 |
| Lifecycle runtime-cold | None | 10 independent cold blocks |
| CPU modes | 5 s in-process | 10 trials of 30 s |
| Memory regular modes | One untimed mode run | 10 |
| Storage | 10 s fio ramp time |
10 trials of 60 s |
| Network | Connection/setup warm-up outside result | 10 trials, at least 60 s and 100,000 requests for p99.9 |
| Density and OOM | One small smoke run | At least 5 per level |
These are starting counts. The pilot will calculate the coefficient of variation and bootstrap confidence-interval width. If an important metric remains unstable, I will increase repetitions or duration for every runtime in that experiment, not only for the runtime with unfavorable results.
12.2 Randomized balanced blocks
Trials will not run as all runc, then all Kata, and so on. Each block will contain one trial for every runtime/configuration in randomized order. This reduces bias from temperature, page-cache evolution, background activity, and time of day. The random seed and actual order will be stored.
12.3 Invalid trials and outliers
A trial may be invalidated only for a documented external reason such as collector failure, corrupted output, wrong image digest, unrelated host activity above the preflight threshold, or load-generator saturation. The raw trial and exclusion reason will remain in the dataset.
Runtime timeouts, crashes, OOM kills, startup failures, and cleanup failures are results. They will not be removed as statistical outliers.
13. Reporting
13.1 Absolute values and ratios
Every result table will show absolute values, trial count, failures, and a normalized comparison.
For metrics where higher is better:
For latency or resource cost where lower is better:
For example, a CPU throughput ratio of 0.80x means the runtime delivers 80% of native throughput, while a lifecycle cost ratio of 1.40x means the operation takes 40% longer than runc.
Native will be the baseline for CPU, memory-performance, storage, and network workloads. runc will also be shown as the OCI baseline. Lifecycle ratios will use runc because native Linux has no OCI lifecycle.
13.2 Statistical summary
For each experiment I will report:
- Attempted, successful, failed, and timed-out trials
- Median and arithmetic mean
- Standard deviation and coefficient of variation
- p95 and p99 across independent trial summaries where meaningful
- Per-operation p50/p90/p95/p99/p99.9 for Fortio and
fio - 95% bootstrap confidence intervals
- Absolute result, native ratio, and
runcratio
Tail percentiles from millions of operations inside one run will not be treated as millions of independent runtime trials. Per-request distributions and across-trial uncertainty will be presented separately.
13.3 Planned figures
- Lifecycle ECDF and median/p95 comparison; p99 only when the sample count is increased enough to support it
- CPU threads versus throughput and scaling efficiency
- Useful work versus total host CPU cost
- Touched memory versus total host memory increase
- Instance count versus host memory and readiness p99
- Storage IOPS/throughput with latency percentile curves
- Offered QPS versus achieved QPS, p99, and errors
- Before/during/recovery tail-latency time series
14. Trial Procedure
Each measured trial will follow the same sequence:
- Validate environment, versions, image digest, available resources, and absence of stale instances.]
- Create a unique trial ID and write the frozen manifest.
- Perform the declared warm-up without saving it as a measured sample.
- Start collectors before runtime create.
- Run the workload with a fixed timeout.
- Save unmodified stdout, stderr, tool JSON, runtime logs, and collector JSONL.
- Validate operation count, checksum, duration, and runtime identity.
- Stop and delete the workload.
- Record success or the exact failed stage.
- Wait the fixed cool-down interval before the next randomized trial.
References
- Open Container Initiative, Runtime and lifecycle specification.
- containerd, Getting started: containers and tasks.
- containerd, Runtime v2 task flow and events.
- Linux Kernel, Control Group v2 documentation.
- Linux Kernel, Pressure Stall Information.
- Linux Kernel,
/procandsmaps_rollupdocumentation. - Fortio, Fortio documentation.
wrk2, Constant-throughput and coordinated-omission methodology.- fio, fio documentation.
- sysbench, sysbench documentation.
- Containerd, Runtime v2.
- Performance Evaluation of Container Runtimes, https://www.scitepress.org/Papers/2020/93404/93404.pdf

|
Hello @ananos @cmainas @amallikopoulou Here is the detailed methodology doc for Phase 1, task one. I am requesting for a review incase there are any areas of improvement, change etc. |
|
On the issue of fetching lifecycle latency we were discussing in last sync meeting, I reached out in different runtime community channels and from recommendations I opted to be watch for the containerd runtime Events as stated in this document https://github.com/containerd/containerd/blob/main/docs/runtime-v2.md And for the Memory and CPU workloads on Then for the storage and network workloads, I will package |

|
Hello @jim-junior , here is a small recap of the last sync:
Some other stuff:
|
|
Hello @ananos @cmainas @amallikopoulou For todays sync I plan to present the PR urunc-dev/evaluation_suite#1 which includes the initial code for the benchmark harness program. |
|
Hello @jim-junior , here are some notes from our last sync:
Some other notes looking at the PR:
|
|
Hello @cmainas I think we can move on to the review of the PR. I also removed the analysis results that I had committed from the PR. |
In the meeting you had mentioned that to Furthermore, the current implementation in the harness only tests urunc on an image that uses the Linux workloads on Qemu, however, according to the |

|
Hello @jim-junior ,
sounds good, do not focus that much towards OpenTelemetry for the time being. We can easily switch towards it later, after other parts of the suite are done.
Yeap, we will help there, you do not have to worry about that. We can do it together in the evaluation machine.
For lifecycle management, we can use an image for Solo5 (rumprun or mirage). For storage, porting fio ro rumprun will not be straightforward. We have to think more about that, but for the time being tou do not have to worry about this. For network, we need to check the compatibility of the benchmark. Again if it is not possible, we will just skip them for now. |
|
I took some time to investigate the possible cause of the unexpected results in gVisor’s storage evaluation. I the following. According to this article, https://gvisor.dev/blog/2023/05/08/rootfs-overlay/, gVisor uses a rootfs overlay that places a writable tmpfs upper layer over the container root filesystem, so writes will occure in this tmpfs filesystem, which i think makes them quicker. In the default self-backed mode, this tmpfs is backed by a hidden host file and accessed through memory mapping, so writes can benefit from host page cache, reduced metadata operations, and fewer expensive filesystem round trips. gVisor also enables DirectFS by default, which allows the sandbox to perform filesystem operations directly using donated file descriptors instead of sending every operation through the Gofer, see https://gvisor.dev/docs/user_guide/filesystem/#directfs This means, So we should keep the default results as they are because they represent how each runtime performs with its intended default configuration, and disabling gVisor’s optimizations would underrepresent its actual design? Also incase you are interested in the exact command I run when benchmarking gvisor its this: /usr/local/bin/nerdctl run --rm -it --runtime=io.containerd.runsc.v1 docker.io/jimjuniorb/fio:0.1 --name=test-runtime --directory=/bench --rw=randrw --bs=4k --size=512M --direct=1 --time_based --runtime=30 --group_reporting --output-format=jsonYou can advise if you would prefer we configure runsc to run otherwise |
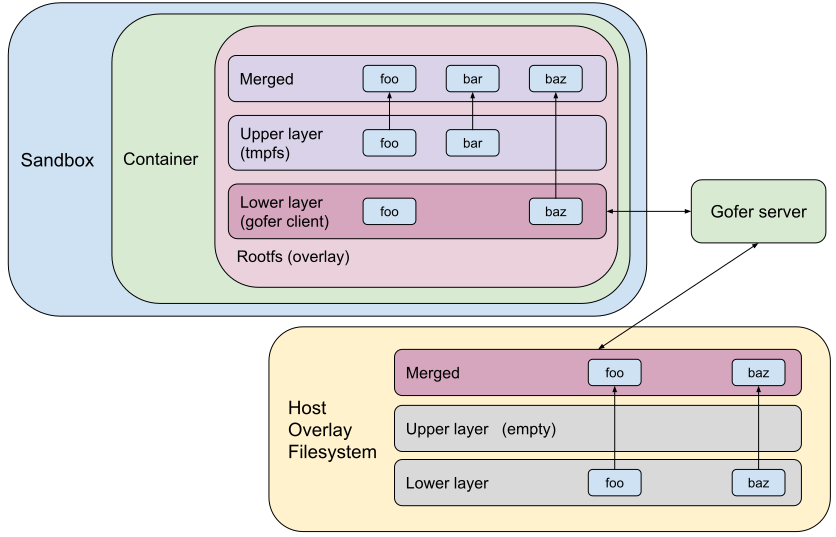
|
I also found some other issue where someone trying to benchmark gVisor and |
|
That is a nice find. We have to investigate this more, because indeed the default configuration in gvisor might favor the storage performance, but we care when the data reach the "same point" in all runtimes. |
|
Hello @jim-junior , just for the kernel configuration and shared-fs options: for 9pfs and for virtiofs: |
|
I have added this and the storage benchmark with |
|
Here is the table of what the current suite supports
As for http readiness latency, I am also done on it however awaiting the merging of the first PR inorder to push it. Mainly to prevent the PR from being excessive and hard to review |
|
Thank you @jim-junior , we can add this table in the PR and update it accordingly with every PR. |
|
Alright |
|
Hello @jim-junior , here are a few notes form the last sync:
|
|
Hello @cmainas An issue occured as i was squashing the commits in the urunc-dev/evaluation_suite#1 PR into one signed off commit, I accidentaly squashed beyond where I had to and also included the intitial commit and pushed the rebased changes. This automatically closed the PR due to inconsistent git histories. So I had to open a new PR, urunc-dev/evaluation_suite#2. Its an identical copy of the previous PR. Maybe the only new change is i also added the kernel configuration for All commits in the new PR are signed off, as you had requested. |
|
Hello @jim-junior , a few notes form our yesterday's sync:
|
|
Slides used in this meeting: https://docs.google.com/presentation/d/1GBnMq4JKDYH1hwGkwnngjkX3WuacYNNLQkowpDbkNlQ/edit?usp=sharing |
|
Hello @cmainas I have opened 2 PRS implementing the following
|
|
As for the Methodology document above, I updated section 6. Lifecycle Methodology to reflect the exact methodology being used by the benchmark |
|
Great, thank you @jim-junior |
|
Just a note from both the PRs. Please sign off your commits, otherwise the DCO action will always fail. |
|
@cmainas I have rebased into signed off commits for both PRs, and force pushed the new commits. The DCO action is now passing |
|
Hi @cmainas I just opened a small PR on the evaluation suite repo, Its a small fix, Just one line. urunc-dev/evaluation_suite#5 |
|
Hello @jim-junior , a small summary of our last sync:
Overall, do not forget that the main goal is to have the evaluation suite configurable and extensible. Changing the tool for a specific benchmark (e.g. HTTP) using a different configuration for a benchmark, adding anew benchmark should be easy, or changing the contianer images should be straightforward. |
|
Hello @cmainas I just opened a PR for CPU Benchmarking with Hoever, It still requires to build a custom kernel for the However the urunc benchmark is failing with these logs: stress-ng: info: [27] setting to a 30 secs run per stressor
stress-ng: error: [27] no CPUs found in /sys/devices/system/cpu
stress-ng: info: [27] dispatching hogs: 1 cpu
Segmentation fault
Kernel panic - not syncing: Attempted to kill init! exitcode=0x00008b00
Kernel Offset: 0x14c00000 from 0xffffffff81000000 (relocation range: 0xffffffff80000000-0xffffffffbfffffff) |
|
Looking at the config of the kernel I see https://github.com/urunc-dev/evaluation_suite/blob/main/workloads/fio-kernel/.config#L1653 which disables sysfs (which is then required for |
|
Hello @cmainas Concerning So i always assumed However after checking in the So i decided to explicitly call it in my bunnyfile entrypoint as #syntax=harbor.nbfc.io/nubificus/bunny:latest
version: v0.1
platforms:
framework: linux
monitor: qemu
architecture: x86
rootfs:
from: jimjuniorb/stress-ng-benchmark:0.1
type: raw
include:
- from: harbor.nbfc.io/nubificus/urunit:latest
source: /urunit
destination: /urunit
kernel:
from: local
path: bzImage
entrypoint: ["/urunit", "/usr/local/bin/stress-ng-wrapper"] # appending urunit hereAfter this, the So to answer your question, |
|
Hello @jim-junior ,
|
|
You can see that the documentation you point to is under the |
|
Okay, I get it now |
|
These are the slides to be used in todays meeting https://docs.google.com/presentation/d/1dgbmz3h-SoDuboQiZMGE-St4Gw9kRb3TETnnlaQeG0I/edit?usp=sharing |
|
Hello @jim-junior , a few notes from the yesterday's meeting:
|
|
Hello @cmainas An update on my progress:
I am left with analyzing the image at https://github.com/virt-pvm/misc/blob/main/pvm-get-started-with-kata.md#verify-kata-containers-with-pvm-using-vm-image and collecting the scripts and parameters used in that evaluation then applying them to the CPU and memory PRs |
|
Hello, These are the slides to be used today: https://docs.google.com/presentation/d/1v5mrabH8IRho3w743aCGxmdLuN8Me2ksBA74OeKz77c/edit?usp=sharing |
|
Hello @cmainas , Ive opened the PR that adds repititions in the HTTP readiness and Memory benchmarks urunc-dev/evaluation_suite#8 |
|
Hello @cmainas , I am trying to configure the runtimes as to have identical or near identical configurations. You had mentioned that urunc had some defaults like using one cpu core(if i remember that right). Apart from the configurations mentioned here https://urunc.io/configuration/ , are there any other defaults or configurations i should be aware about? |
|
Further more, i have been reaching out to gVisor here https://groups.google.com/g/gvisor-users/c/CHJOPOb7kCk and now via a private email thread to help handle the weird |
|
Hello @jim-junior , from the urunc side, there are no other configuration options. However, for the kernel, in order to disable boot logs, you can either change the boot parameters https://github.com/urunc-dev/urunc/blob/main/pkg/unikontainers/unikernels/linux.go#L70 or build the kernel with lower default log level https://github.com/urunc-dev/evaluation_suite/blob/ecb852a1004dc3ae8b3bcf0009e0b604b0bf300b/workloads/fio-kernel/.config#L2002 (You have already done that for fio kernels). |
|
Hello @jim-junior , I have done some changes in the Kata and gvisor configuration. For Kata I set 1 vcpu and 1G for memory (default and max) while on gvisor I set the platform to KVM. An important note is that the invocation of all containers should be done setting memory and cpu limits (for all runtimes) because otherwise the default values will be used. Specifically for memory you can use the |
|
Hello @jim-junior , a few note from last sync
|
|
I killed one of your containers though. Hope that is ok. |
Its okay I had forgotten to delete it, its what i was using to investigate cgroups. |
I have run the experiment again and it works now. These are the results below, when using qemu 
|
|
Great, this makes sense, Kata is cheating though https://github.com/kata-containers/kata-containers/blob/main/docs/design/host-cgroups.md#sandbox_cgroup_only--false-default-setting . Let me re-configure it. |
|
Switched to true. |


Uh oh!
There was an error while loading. Please reload this page.
Uh oh!
There was an error while loading. Please reload this page.
Mentee: @jim-junior (Beingana Jim Junior)
Mentors: @ananos (Tassos), @cmainas (Babis), @amallikopoulou (Anastasia)
Term: June 8 – August 29, 2026 (12 weeks) · Midterm evaluation: end of Week 6 (~July 21) · Final evaluation: end of Week 12 (~August 29)
Sync: Weekly call, Mondays · Ad-hoc deep-dive sessions as needed · Async via this Discussion + CNCF Slack (#urunc)
Background & motivation
urunc is a lightweight sandboxed container runtime; performance is a core project promise. We currently lack a robust, reproducible evaluation suite: running the same measurement on the same machine on different days does not yield consistent results (storage/devmapper snapshot provisioning, machine I/O load, and orchestrator layers such as Kubernetes scheduling all introduce variance).
The goal of this mentorship is a benchmarking suite that (a) measures urunc against other runtimes fairly (apples-to-apples), (b) is reproducible; publishable scripts that anyone can run and obtain the same results/ratios, and (c) eventually runs as a scheduled GitHub Action to catch performance regressions as the codebase evolves.
Runtimes under test: urunc (focus), runc (baseline), Kata Containers, gVisor. Scripts must be runtime-agnostic.
Notes: spawn time and density are already benchmarked; prioritize network, storage/I/O, and memory.
cgroupssupport in urunc is expected to land in the coming weeks and will simplify resource accounting. Memory methodology must distinguish guest-assigned / VMM / host / physical memory (RSS alone is misleading e.g. Kata assigned 256 MB showing ~40 MB RSS on Raspberry Pi runs).Goal
A reproducible, runtime-agnostic benchmark/regression suite for urunc vs runc/Kata/gVisor — kick off the scripts, get results, compare against previous runs — merged in the
urunc-devorg and wired into CI as a scheduled action.Metrics matrix
Plan (by week)
Phase 0 — Onboarding & environment (Weeks 1–2, Jun 8–21)
Phase 1 — Methodology & harness skeleton (Weeks 3–5, Jun 22–Jul 12)
Phase 2 — Midterm milestone (Week 6, Jul 13–19)
🎯 Concrete milestone for the midterm evaluation (end of Week 6, ~Jul 21):
Acceptance criteria:
./run-bench.sh(or equivalent) executes the suite unattended across runc, urunc, Kata, gVisorPhase 3 — Full metric coverage (Weeks 7–9, Jul 20–Aug 9)
Phase 4 — CI integration & wrap-up (Weeks 10–12, Aug 10–29)
urunc-dev; final evaluation + mentee feedback/blog submission (end of Week 12)Stretch goals (time permitting)
References
Status updates: please post a short weekly comment (done / in progress / blockers) before each Monday sync.
All reactions