



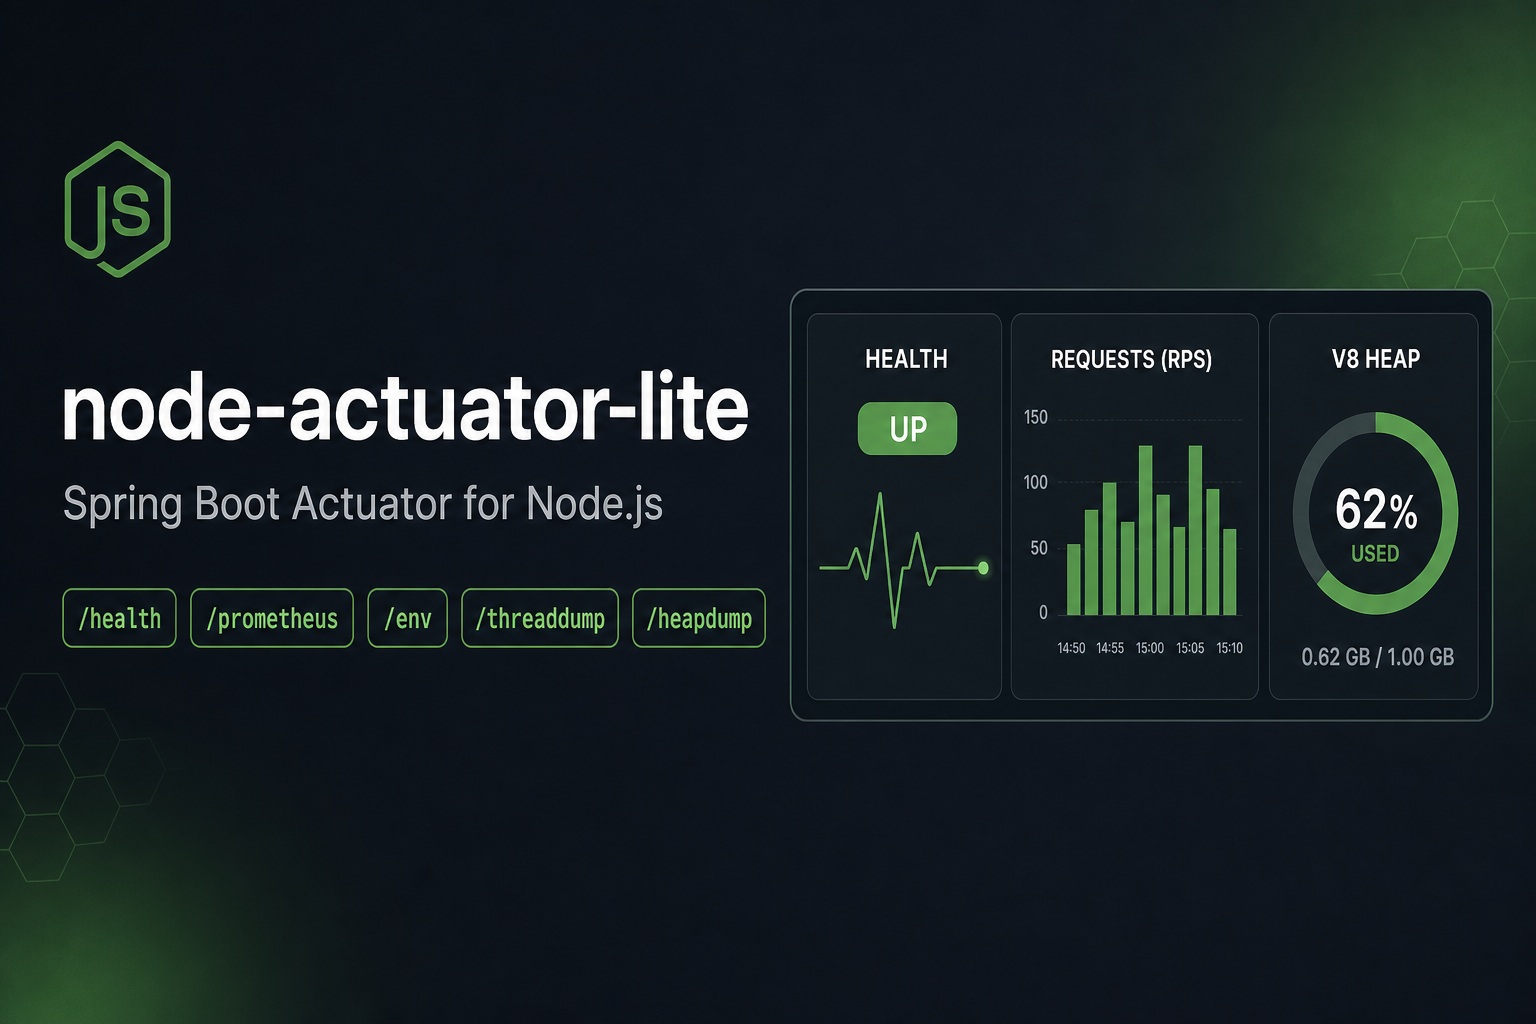
Spring Boot Actuator for Node.js — lightweight monitoring endpoints, a built-in dashboard, and a single runtime dependency.
npm install node-actuator-liteimport express from 'express';
import { actuatorMiddleware } from 'node-actuator-lite';
const app = express();
const { handler } = actuatorMiddleware();
app.use(handler);
app.listen(3000, () => console.log('http://localhost:3000/actuator'));import Fastify from 'fastify';
import { actuatorPlugin } from 'node-actuator-lite';
const app = Fastify();
await app.register(actuatorPlugin);
await app.listen({ port: 3000 });
console.log('http://localhost:3000/actuator');Requires Node.js >= 22. The only runtime dependency is
prom-client.CJS/ESM: The package ships CommonJS (
require). If you use ES modules, either import from'node-actuator-lite'(Node resolves the CJS export) or use a bundler that handles CJS interop. A dual ESM build is on the roadmap.
| Spring Boot Endpoint | node-actuator-lite | Status |
|---|---|---|
/actuator (discovery) |
✅ | Shipped |
/actuator/health |
✅ (shallow/deep, groups, custom indicators) | Shipped |
/actuator/info |
✅ (build + runtime + contributors) | Shipped |
/actuator/env |
✅ (masked, allowlist, connection-string aware) | Shipped |
/actuator/metrics |
✅ (process JSON + Prometheus) | Shipped |
/actuator/prometheus |
✅ (prom-client, custom metrics) | Shipped |
/actuator/threaddump |
✅ (event-loop, handles, ELU, workers) | Shipped |
/actuator/heapdump |
✅ (async, throttled) | Shipped |
/actuator/loggers |
✅ (Pino/Winston/Bunyan, runtime level change) | Shipped |
/actuator/mappings |
🗺️ Route inventory | Roadmap |
/actuator/httpexchanges |
🗺️ Recent request history | Roadmap |
/actuator/caches |
— | Not planned |
/actuator/beans |
— | N/A (no DI container) |
/actuator/conditions |
— | N/A (no auto-config) |
/actuator/configprops |
— | N/A |
/actuator/flyway / liquibase |
— | N/A |
/actuator/sessions |
— | Not planned |
/actuator/scheduledtasks |
🗺️ | Roadmap |
/actuator/shutdown |
🗺️ Graceful shutdown | Roadmap |
If you're coming from Spring Boot, you expect /actuator/health, /actuator/info, /actuator/env, and /actuator/prometheus out of the box. This library gives you exactly that for Node.js — one dependency, zero config, and adapters for Express, Fastify, Koa, the built-in http module, and serverless. It also ships a self-contained HTML dashboard so you can eyeball your service without wiring up Grafana first.
- Health — shallow (status only) and deep (per-component details), custom indicators, and health groups for Kubernetes liveness / readiness.
- Info — build metadata plus runtime details, with pluggable info contributors.
- Metrics — process-level CPU, memory, and uptime as JSON.
- Environment —
process.envas Spring-style property sources, with automatic sensitive-value masking and an optional allowlist. - Thread Dump — event-loop state, active handles/requests, V8 heap stats, and worker threads.
- Heap Dump — V8 heap snapshots saved to disk, throttled to prevent abuse.
- Prometheus — all default Node.js metrics plus custom counters, gauges, histograms, and summaries via
prom-client, or inject your app's existingRegistryto avoid duplicate registrations. - Loggers — Spring Boot-style
/actuator/loggers: list every logger and change levels at runtime, with adapters for Pino, Winston, and Bunyan. - Dashboard — a self-contained HTML page at
/actuator/dashboardthat surfaces every enabled endpoint. - Discovery —
GET /actuatorlists all enabled endpoints, just like Spring Boot. - Custom endpoints — register your own routes under
/actuator, per instance or globally. - Framework adapters — Express, Fastify, Koa, and
node:http, plus a serverless mode with direct method calls. - Pluggable auth & logging — a single
authcallback guards every endpoint, and any logger (pino, winston, …) can be injected. - Single runtime dependency —
prom-client.
Actuator endpoints expose operational data. In production, use the preset: 'production' option to disable sensitive endpoints by default, or gate everything behind an auth callback.
preset is never inferred automatically — endpoint defaults never change just because NODE_ENV=production is set, so upgrading this library can't silently disable endpoints in an existing deployment. If NODE_ENV=production is detected without an explicit preset, a console warning suggests setting preset: 'production'. A separate warning is emitted whenever sensitive endpoints are enabled without an auth callback.
import { NodeActuator } from 'node-actuator-lite';

// Explicit production preset — safest option:
const actuator = new NodeActuator({
  port: 8081,
  preset: 'production',
  auth: ({ raw }) => true, // replace with a real token/allowlist check
  health: {
    groups: {
      liveness: ['process'],
      readiness: ['diskSpace'],
    },
  },
  prometheus: { enabled: true },
});
Production preset disables: /env, /threaddump, /heapdump, /loggers, /dashboard.
Production preset enables: /health (shallow only), /info, /metrics, /prometheus.
You can still override individual endpoints:
new NodeActuator({
  preset: 'production',
  env: { enabled: true }, // explicitly opt in
  auth: checkBearerToken,
});npm install node-actuator-liteRequires Node.js >= 22. The only runtime dependency is
prom-client.
import { NodeActuator } from 'node-actuator-lite';

const actuator = new NodeActuator({
  port: 8081,
  health: {
    showDetails: 'always',
    custom: [
      {
        name: 'database',
        critical: true,
        check: async () => ({ status: 'UP', details: { latency: '2ms' } }),
      },
    ],
    groups: {
      liveness: ['process'],
      readiness: ['diskSpace', 'database'],
    },
  },
  prometheus: {
    customMetrics: [
      { name: 'http_requests_total', help: 'Total HTTP requests', type: 'counter', labels: ['method', 'path'] },
    ],
  },
});

await actuator.start();
// Actuator listening on http://localhost:8081/actuator
// Dashboard at http://localhost:8081/actuator/dashboardimport express from 'express';
import { actuatorMiddleware } from 'node-actuator-lite';
const app = express();
const { handler, actuator } = actuatorMiddleware({ prometheus: { defaultMetrics: true } });
app.use(handler);
// All /actuator/* endpoints are now live.
// Access the actuator instance for custom metrics:
// actuator.prometheus.metric('my_counter')!.inc();
app.listen(3000);import Fastify from 'fastify';
import { actuatorPlugin } from 'node-actuator-lite';
const app = Fastify();
await app.register(actuatorPlugin, { prometheus: { defaultMetrics: true } });
// All /actuator/* routes registered. Access the instance via app.actuator.
await app.listen({ port: 3000 });import Koa from 'koa';
import { actuatorKoa } from 'node-actuator-lite/middleware/koa';
const app = new Koa();
const { middleware, actuator } = actuatorKoa({ prometheus: { defaultMetrics: true } });
app.use(middleware);
// actuator.prometheus.metric('my_counter')!.inc();
app.listen(3000);import http from 'node:http';
import { actuatorHttp } from 'node-actuator-lite/middleware/http';
const { handler, actuator } = actuatorHttp({ prometheus: { defaultMetrics: true } });
// As a standalone server:
http.createServer(handler).listen(8080);
// Or chained to your own router — requests outside basePath fall through to next():
// server.on('request', (req, res) => handler(req, res, () => myRouter(req, res)));In serverless mode no server is started; you call the data methods directly.
import { NodeActuator } from 'node-actuator-lite';

const actuator = new NodeActuator({ serverless: true });
await actuator.start(); // no-op, no server started

const health  = await actuator.getHealth();          // shallow
const deep    = await actuator.getHealth('always');   // deep
const info    = await actuator.getInfoAsync();
const metrics = actuator.getMetrics();
const prom    = await actuator.getPrometheus();
const env     = actuator.getEnv();
const threads = actuator.getThreadDump();
const heap = await actuator.getHeapDump();All endpoints live under the configured basePath (default /actuator). Each row appears in discovery only when its feature is enabled.
| Method | Path | Description |
|---|---|---|
| GET | /actuator |
Discovery — lists all enabled endpoints |
| GET | /actuator/dashboard |
Self-contained HTML dashboard |
| GET | /actuator/health |
Health check (shallow or deep based on config) |
| GET | /actuator/health?showDetails=always |
Force deep health check |
| GET | /actuator/health/{component} |
Single health component |
| GET | /actuator/health/{group} |
Health group (e.g. liveness, readiness) |
| GET | /actuator/info |
Build and runtime information |
| GET | /actuator/metrics |
Process metrics (CPU, memory, uptime) as JSON |
| GET | /actuator/env |
Environment variables (masked) |
| GET | /actuator/env/{name} |
Single environment variable |
| GET | /actuator/threaddump |
Thread / event-loop dump |
| POST | /actuator/heapdump |
Generate and save a V8 heap snapshot |
| GET | /actuator/prometheus |
Prometheus metrics (text exposition format) |
| GET | /actuator/loggers |
List all loggers and their levels |
| GET | /actuator/loggers/{name} |
Single logger's level |
| POST | /actuator/loggers/{name} |
Change a logger's level at runtime ({ "configuredLevel": "DEBUG" }) |
A self-contained HTML dashboard is served at <basePath>/dashboard (enabled by default). It renders the discovery view and links to every enabled endpoint, with no external assets or CDN calls — useful for a quick look at a running service before reaching for a full metrics stack.
Disable it in locked-down environments:
const actuator = new NodeActuator({ dashboard: { enabled: false } });The full option shape lives in src/core/types.ts (ActuatorOptions). The most common options:
interface ActuatorOptions {
  port?: number;            // default 0 (random); standalone server only
  basePath?: string;        // default '/actuator'
  serverless?: boolean;     // default false

  /**
   * Safety preset. 'production' disables /env, /threaddump, /heapdump,
   * /loggers, /dashboard and hides health details by default. Never inferred
   * from NODE_ENV automatically — see "Production Safety" above.
   */
  preset?: 'production' | 'development';

  /** Authorization callback applied to every endpoint. Return false → 401. */
  auth?: (ctx: {
    method: string;
    subPath: string;
    query: Record<string, string>;
    params: Record<string, string>;
    raw?: unknown;
  }) => boolean | Promise<boolean>;

  /** Custom logger (pino/winston/…). Defaults to the built-in JSON console logger. */
  logger?: {
    trace(msg: string, data?: unknown): void;
    debug(msg: string, data?: unknown): void;
    info(msg: string, data?: unknown): void;
    warn(msg: string, data?: unknown): void;
    error(msg: string, data?: unknown): void;
  };

  info?: {
    enabled?: boolean;                  // default true
    build?: Record<string, any>;        // overrides auto-detected package.json info
    contributors?: Array<{
      name: string;
      collect: () => Record<string, any> | Promise<Record<string, any>>;
    }>;
  };

  metrics?: { enabled?: boolean };      // default true

  health?: {
    enabled?: boolean;                  // default true
    showDetails?: 'never' | 'always';   // default 'always'
    timeout?: number;                   // per-indicator timeout in ms, default 5000
    indicators?: {
      diskSpace?: { enabled?: boolean; threshold?: number; path?: string };
      process?: { enabled?: boolean };
    };
    groups?: Record<string, string[]>;  // e.g. { liveness: ['process'], readiness: ['diskSpace', 'db'] }
    custom?: Array<{
      name: string;
      check: () => Promise<{ status: 'UP' | 'DOWN' | 'OUT_OF_SERVICE' | 'UNKNOWN'; details?: Record<string, any> }>;
      critical?: boolean;               // if true, DOWN here → overall DOWN
    }>;
  };

  env?: {
    enabled?: boolean;      // default true
    mask?: {
      patterns?: string[];    // default ['PASSWORD','SECRET','KEY','TOKEN','AUTH','CREDENTIAL','PRIVATE','SIGNATURE']
      additional?: string[];  // extra variable names to mask
      replacement?: string;   // default '******'
      allowlist?: string[];   // if set, ONLY these variables are exposed at all
    };
  };

  threadDump?: { enabled?: boolean };   // default true

  heapDump?: {
    enabled?: boolean;      // default true
    outputDir?: string;     // default './heapdumps'
    minIntervalMs?: number; // throttle window between dumps, default 60000 (0 disables)
  };

  prometheus?: {
    enabled?: boolean;      // default true
    defaultMetrics?: boolean; // collect default Node.js metrics, default true
    prefix?: string;
    customMetrics?: Array<{
      name: string;
      help: string;
      type: 'counter' | 'gauge' | 'histogram' | 'summary';
      labels?: string[];
      buckets?: number[];   // histogram only
    }>;
    /** Inject an existing prom-client Registry instead of creating a new one. */
    registry?: import('prom-client').Registry;
  };

  /** Built-in HTML dashboard at `<basePath>/dashboard`. Enabled by default. */
  dashboard?: { enabled?: boolean };

  /** Dynamic loggers endpoint (list/change log levels at runtime). Enabled by default. */
  loggers?: { enabled?: boolean };

  /** Custom endpoints mounted under basePath. */
  endpoints?: Array<{
    id: string;
    method?: 'GET' | 'POST';
    handler: (context?: {
      method?: string;
      path?: string;
      params?: Record<string, string>;
      query?: Record<string, string>;
      raw?: any;
    }) => any | Promise<any>;
    contentType?: 'json' | 'text';
  }>;
}Shallow (showDetails: 'never', or the default GET /actuator/health):
{ "status": "UP" }Deep (showDetails: 'always', or GET /actuator/health?showDetails=always):
{
  "status": "UP",
  "components": {
    "diskSpace": {
      "status": "UP",
      "details": { "total": 499963174912, "free": 250000000000, "threshold": 10485760, "path": "/" }
    },
    "process": {
      "status": "UP",
      "details": { "pid": 12345, "uptime": 3600, "version": "v20.11.0" }
    },
    "database": {
      "status": "UP",
      "details": { "latency": "2ms" }
    }
  }
}Model Kubernetes liveness and readiness probes:
const actuator = new NodeActuator({
  health: {
    groups: {
      liveness: ['process'],
      readiness: ['diskSpace', 'database'],
    },
  },
});
GET /actuator/health/liveness→ aggregated status ofprocessonlyGET /actuator/health/readiness→ aggregated status ofdiskSpace+database
Returns HTTP 200 when UP, 503 when DOWN.
const actuator = new NodeActuator({
  health: {
    custom: [
      {
        name: 'redis',
        critical: true,
        check: async () => {
          const ok = await redis.ping();
          return ok
            ? { status: 'UP', details: { latency: '1ms' } }
            : { status: 'DOWN', details: { error: 'ping failed' } };
        },
      },
    ],
  },
});
Add or remove indicators at runtime:
actuator.health.addIndicator({ name: 'cache', check: async () => ({ status: 'UP' }) });
actuator.health.removeIndicator('cache');GET /actuator/info returns build metadata (auto-detected from package.json, or overridden via info.build) plus runtime details. Info contributors let you append computed sections:
const actuator = new NodeActuator({
  info: {
    build: { name: 'orders-service', version: '1.4.2' },
    contributors: [
      { name: 'git', collect: () => ({ commit: process.env.GIT_SHA }) },
    ],
  },
});
{
"build": { "name": "orders-service", "version": "1.4.2" },
"runtime": {
"nodeVersion": "v20.11.0",
"platform": "linux",
"arch": "x64",
"pid": 12345,
"cwd": "/app",
"uptime": 3600
},
"contributors": { "git": { "commit": "a1b2c3d" } }
}GET /actuator/metrics returns process-level metrics as JSON (distinct from the Prometheus text endpoint):
{
  "process": {
    "uptime": 3600,
    "memory": { "rss": 52428800, "heapTotal": 20971520, "heapUsed": 15728640 },
    "cpu": { "user": 1200000, "system": 350000 }
  }
}GET /actuator/env returns a Spring-style property-source response with sensitive values masked:
{
  "activeProfiles": ["production"],
  "propertySources": [
    {
      "name": "systemEnvironment",
      "properties": {
        "PATH": { "value": "/usr/local/bin:..." },
        "DATABASE_PASSWORD": { "value": "******" }
      }
    },
    {
      "name": "systemProperties",
      "properties": {
        "node.version": { "value": "v20.11.0" },
        "os.hostname": { "value": "my-server" }
      }
    }
  ]
}
For defence-in-depth in production, set env.mask.allowlist so that only named variables are exposed and everything else is omitted entirely. Values that look like connection strings (postgres://user:pass@host/db, mongodb+srv://..., redis://..., etc.) have only the password segment masked — the host and database name stay visible for debugging, even when the key itself matches a mask pattern.
GET /actuator/prometheus exposes metrics in Prometheus text format, backed by prom-client — the library's one runtime dependency.
If your app already runs its own prom-client Registry, inject it so actuator metrics land in the same registry instead of creating a second, isolated one:
import { Registry } from 'prom-client';

const registry = new Registry();
const actuator = new NodeActuator({ prometheus: { registry } });GET /actuator/loggers lists every known logger and its level; POST /actuator/loggers/{name} changes one at runtime — handy for turning on DEBUG in production without a redeploy.
curl http://localhost:8081/actuator/loggers
curl http://localhost:8081/actuator/loggers/ROOT
curl -X POST http://localhost:8081/actuator/loggers/ROOT \
  -H 'Content-Type: application/json' \
  -d '{"configuredLevel":"DEBUG"}'
The built-in logger (ROOT) is wired up out of the box. To manage an external logging library at runtime, register an adapter:
import { PinoLoggerAdapter, WinstonLoggerAdapter, BunyanLoggerAdapter } from 'node-actuator-lite';

// Pino
actuator.loggers.addAdapter(new PinoLoggerAdapter(pinoLogger));

// Winston — OFF maps to Winston's `silent` flag (Winston has no silent level)
actuator.loggers.addAdapter(new WinstonLoggerAdapter(winstonLogger));

// Bunyan — OFF sets a level above FATAL so nothing is emitted
actuator.loggers.addAdapter(new BunyanLoggerAdapter(bunyanLogger));
With more than one adapter registered, logger names are qualified as {adapter}:{logger} (e.g. pino:ROOT) in GET /actuator/loggers and in the POST body's target name.
POST /actuator/heapdump writes a .heapsnapshot to heapDump.outputDir and returns metadata:
{
  "timestamp": "2025-01-15T10:30:00.000Z",
  "pid": 12345,
  "filePath": "./heapdumps/heapdump-2025-01-15T10-30-00-000Z-a1b2c3d4.heapsnapshot",
  "fileSize": 15728640,
  "duration": 1250,
  "memoryBefore": { "heapUsed": 15728640 },
  "memoryAfter": { "heapUsed": 16777216 }
}
Heap dumps block the event loop, so requests are throttled to one per heapDump.minIntervalMs (default 60s). Open the .heapsnapshot file in Chrome DevTools → Memory → Load.
Mount your own endpoints under basePath. They appear in discovery and are served by every adapter.
Per instance, via config:
const actuator = new NodeActuator({
  endpoints: [
    { id: 'build', handler: () => ({ commit: process.env.GIT_SHA }) },
  ],
});
Or at runtime on an instance:
actuator.registerEndpoint({ id: 'cache-stats', handler: () => cache.stats() });Or globally — useful for ecosystem packages that extend any actuator created afterwards:
import { registerEndpoint } from 'node-actuator-lite';

registerEndpoint('feature-flags', () => flags.snapshot(), { contentType: 'json' });// api/actuator/[...path].js
import { NodeActuator } from 'node-actuator-lite';
const actuator = new NodeActuator({ serverless: true });
export default async function handler(req, res) {
const segments = req.query['...path'];
const path = Array.isArray(segments) ? segments.join('/') : segments || '';
switch (path) {
case '':
return res.json(actuator.discovery());
case 'health':
return res.json(await actuator.getHealth());
case 'info':
return res.json(await actuator.getInfoAsync());
case 'metrics':
return res.json(actuator.getMetrics());
case 'env':
return res.json(actuator.getEnv());
case 'threaddump':
return res.json(actuator.getThreadDump());
case 'prometheus':
res.setHeader('Content-Type', 'text/plain');
return res.send(await actuator.getPrometheus());
default:
return res.status(404).json({ error: 'Not found' });
}
}import { NodeActuator } from 'node-actuator-lite';
import type { APIGatewayProxyEvent, APIGatewayProxyResult } from 'aws-lambda';
const actuator = new NodeActuator({ serverless: true });
export const handler = async (event: APIGatewayProxyEvent): Promise<APIGatewayProxyResult> => {
const path = event.pathParameters?.proxy || '';
const routes: Record<string, () => Promise<{ code: number; type: string; body: string }>> = {
health: async () => ({ code: 200, type: 'application/json', body: JSON.stringify(await actuator.getHealth()) }),
info: async () => ({ code: 200, type: 'application/json', body: JSON.stringify(await actuator.getInfoAsync()) }),
metrics: async () => ({ code: 200, type: 'application/json', body: JSON.stringify(actuator.getMetrics()) }),
env: async () => ({ code: 200, type: 'application/json', body: JSON.stringify(actuator.getEnv()) }),
prometheus: async () => ({ code: 200, type: 'text/plain', body: await actuator.getPrometheus() }),
threaddump: async () => ({ code: 200, type: 'application/json', body: JSON.stringify(actuator.getThreadDump()) }),
};
const route = routes[path];
if (!route) return { statusCode: 404, body: '{"error":"Not found"}' };
const result = await route();
return { statusCode: result.code, headers: { 'Content-Type': result.type }, body: result.body };
};Every endpoint has a method equivalent — no HTTP server required.
const actuator = new NodeActuator({ serverless: true });

// Discovery
actuator.discovery();

// Health
await actuator.getHealth();                   // shallow or deep (based on config)
await actuator.getHealth('always');           // force deep
await actuator.getHealthComponent('diskSpace');
await actuator.getHealthGroup('readiness');

// Info & metrics
actuator.getInfo();         // sync, no contributors
await actuator.getInfoAsync(); // includes contributors
actuator.getMetrics();

// Environment
actuator.getEnv();
actuator.getEnvVariable('NODE_ENV');

// Thread dump
actuator.getThreadDump();

// Heap dump
await actuator.getHeapDump();

// Prometheus
await actuator.getPrometheus();

// Loggers
actuator.loggers.collect();                          // list all loggers
actuator.loggers.getLogger('ROOT');
actuator.loggers.setLevel('ROOT', 'DEBUG');
actuator.loggers.addAdapter(new PinoLoggerAdapter(pinoLogger));

// Custom endpoints
actuator.registerEndpoint({ id: 'build', handler: () => ({ commit: 'abc' }) });
await actuator.invokeEndpoint('build');node-actuator-lite is part of a small Node.js observability ecosystem you can adopt independently or together:
node-actuator-lite— Spring Boot-style/actuator/health,/info,/metrics,/env,/threaddump,/heapdump, and/prometheusendpoints.node-eventloop-watchdog— Detects event-loop stalls, captures stack traces and hotspots, and triggers recovery.node-request-trace— Per-request timelines, browser dashboard, and CLI without OpenTelemetry.
When all three are installed:
node-eventloop-watchdogautomatically registers/actuator/eventloop,/actuator/eventloop/history,/actuator/eventloop/hotspots, and/actuator/eventloop/metricsunder this actuator.- Event-loop block events include the active request id, route, and method captured by
node-request-trace.
Runnable example: examples/ecosystem.
Quickest setup: Use
node-observability-liteto wire the three packages together with production-safe presets in one line.const observability = require('node-observability-lite'); observability.express(app, { preset: 'production', auth: req => req.get('authorization') === `Bearer ${process.env.OPS_TOKEN}`, });
Runnable examples live in examples/:
- Express app with bearer-token protected actuator routes
- Fastify app with safe endpoint defaults
- AWS Lambda handler using serverless mode
- Kubernetes deployment probes for liveness and readiness
See CONTRIBUTING.md for development setup and release checks.
Security issues should be reported privately; see SECURITY.md.
Release notes are tracked in CHANGELOG.md.
MIT — see LICENSE.